
Notes
Almost every owner checks the same thing, finds nothing, and stops. The check is right. It just doesn’t measure the exposure that reprices deals.
In July 2026 a fund called Situational Awareness held five companies. Four of them traded on Nasdaq, one in Seoul. Different products, different customers, different continents, and CNBC reported every one of them down between 27% and 54% inside the same month. By the morning of 30 July 2026 its public holdings had gone to Citadel, at what CNBC reported was below where the shares were trading.
Five holdings is not a concentrated book by any ordinary measure. It was one position anyway, because all five sold into the same spending decision, and no list of names can spread a risk that only has one shape.
None of that mechanism reaches you. It’s worth saying so before going further, because there was borrowed money behind it and a creditor entitled to act on what had been pledged, without waiting for anyone. You may have nothing of the kind. If you do have something of the kind, a factoring line or a bank facility sitting behind a personal guarantee, then the distance between that story and yours is shorter than it looks. You already know that.
What travels either way is the test that missed it.
What owners check, and why it comes back clean
Ask an owner about concentration and he’ll tell you his biggest client is under a tenth of revenue. He’s usually right about it, having checked. Thirty clients, none of them large enough to matter on their own, and every published figure clean.
That check measures a share. One counterparty, divided by total revenue, expressed as a percentage. It’s the right question and it has a good answer.
Now hold it against the thing it can’t see. Those thirty clients each arrived through one ad account. Or one app store listing, or one search algorithm, or one partner’s directory. No single client can hurt you and the whole book sits behind one gate. Nothing in the share calculation reports that, because the share calculation was never asking.
The four bands, and where they came from
Here’s how I read single-counterparty concentration when I’m looking at a business. These are this practice’s bands, not an industry statistic. I’d rather say that plainly than have one of them quoted back to me one day as a fact somebody measured.
Below 10%, clean
Nothing. It doesn’t come up.
10% to 20%, noted
Asks for the contract, the renewal history and the payment record. No effect on price by itself.
20% to 30%, priced
Enters the model. This is where price starts moving.
Above 30%, deal-killer
Structure changes. Escrow, an earn-out, or a walk.
Share of revenue from one customer, supplier or channel. These are this practice’s bands, not a published industry standard.
Two things about that scale matter more than the numbers in it.
The first is that concentration doesn’t arrive as one thing. Customer concentration is one question, channel concentration is a different question, and supplier or platform concentration is a third. They fail separately and a business can be clean on all three while every revenue line still ends on the same event.
The second is that the correlated case has no band at all, because it isn’t a share. It’s a count.
The count
An hour and one sheet of paper.
First, decide what a revenue line is for your business, then stay consistent about it. A revenue line is the smallest unit you’d lose all at once. For an agency that’s usually a client. For a SaaS it’s usually a plan or a segment. For an e-commerce brand it’s a product or a channel, and quite often you’ll need to run it twice, once by product and once by channel, because those two counts answer different questions.
The four steps
- List every revenue line down a page, by client, by channel, by product.
- Next to each, write the single event that would end it. Not “if things went badly”, but one event, named, in the world: this platform changes its policy, this partner delists us, this algorithm updates, this supplier stops, this contract isn’t renewed.
- Circle any event that appears more than once.
- Add up the revenue sitting behind the event that repeats most.
Divide it by total revenue and you have a share, which is the form the four bands above can read. That number is what you didn’t have before, and it is usually larger than the one you already knew.
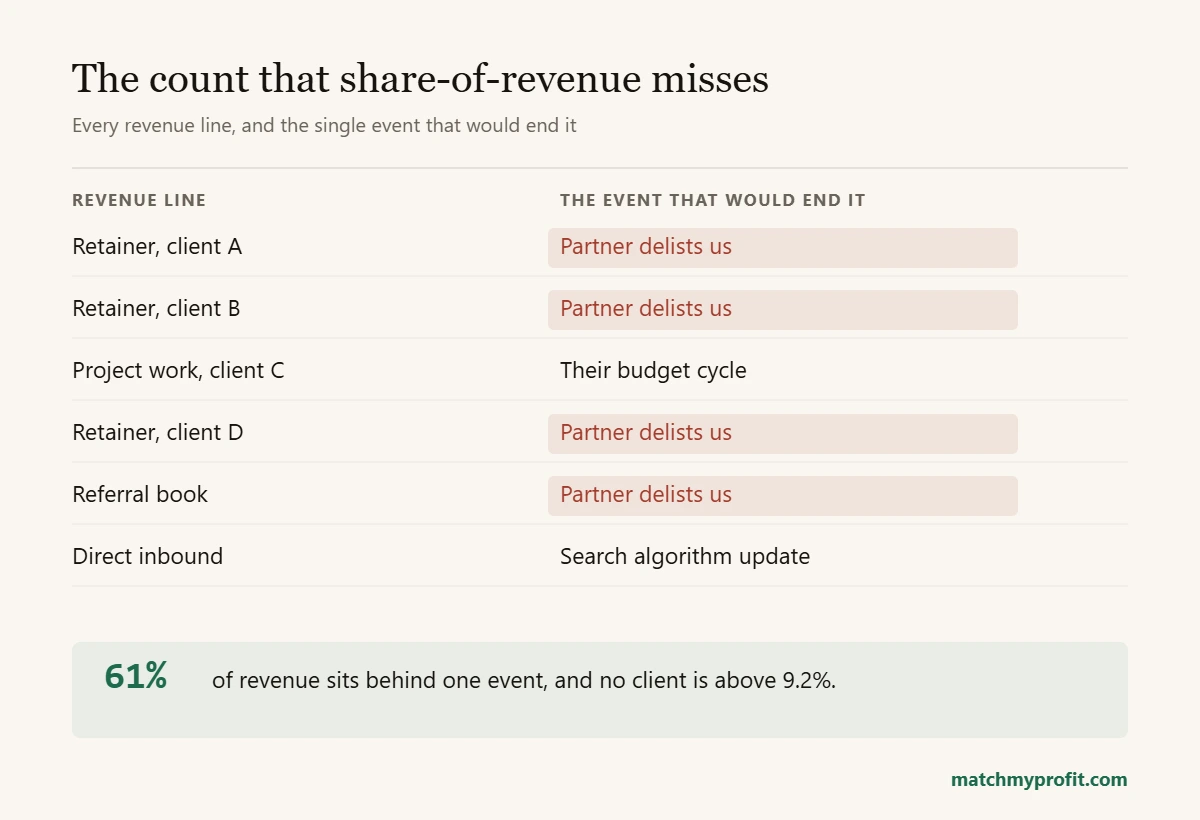
The same book, counted the other way. Illustrative arithmetic, not a client’s accounts.
Reading the answer, and again this is my read rather than a standard. Under a quarter of revenue on one event is ordinary, because every business has some of this and none of it gets fixed to zero. A quarter to a half is the thing a buyer finds, so the useful move is to have written it down before he does. Above half, it isn’t a risk sitting inside the story of the business. It is the story, which makes it the story of the deal.
He works this out anyway, and here’s what he reads
The reason to run it early isn’t that the finding is secret. It’s that it isn’t.
A buyer reaches most of this from outside, before anyone gives him permission. The email domains in your customer list tell him who your clients actually are. The referral and campaign data in your analytics export tells him where they came from. The ad library tells him what you’re running and roughly since when. Your backlink profile tells him which single site sends the traffic. The app store or marketplace listing tells him whose platform you’re standing on. And the top-ten table you hand him yourself does the rest.
There’s a second check in that pile worth knowing about, because it’s cheap and almost nobody runs it on themselves. Put revenue share next to receivables share, client by client. A client who’s a bigger share of your unpaid invoices than of your revenue is telling you something about which way the pressure runs in that relationship. A buyer reads that pair in about a minute.
A shape, not a case
Take an agency at €1.84M of revenue with 31 clients. The largest is 9.2%, which clears the clean band comfortably. That’s the number that goes in the deck.
Nineteen of those 31 arrived through one partner’s directory listing, and those nineteen are 61% of revenue. Nothing in the concentration answer reported it. The partner reviews its directory annually, which means the whole business has a renewal date nobody wrote in a calendar.
That’s illustrative arithmetic rather than somebody’s real accounts. The shape is the point. You can probably tell inside a minute whether it’s yours.
When it’s fine, and when this is the wrong advice
Correlated concentration isn’t automatically a problem. A good buyer will shrug at plenty of it. Multi-year contracts with real switching costs behind them. A channel you part-own rather than rent. Supply that’s regulated in a way that makes the relationship stickier than a commercial one. If your shared event is three years out and contracted, what you have is a disclosure.
And if you’re two years into building something, one channel working is not a flaw to be corrected. It’s the thing that’s working. Spreading it now would slow you down for a buyer you haven’t met.
There’s also the owner who runs the count and gets a bad answer he can’t change. A marketplace-native brand. A business built on one platform’s certification. That shape isn’t going to loosen just because it would sell better loose, so I won’t pretend otherwise. What’s available to him is a different move: the count, the contracts, the renewal dates and the history, written up on his own paper, two years before anyone asks. It doesn’t remove the exposure. It changes who controls the moment it gets discussed, and that turns out to be most of what the price is arguing about.
The one thing I’d avoid on a bad answer is starting a diversification programme that halves the margin in order to improve a ratio. Buyers price margin as well, which they get to sooner.
The date is the whole argument
The fund had a creditor. What you have is a buyer, which is slower and no gentler. The number comes back lower somewhere around week seven, nobody rings to warn you, and by then the fixes that would have helped needed two years and the deal has weeks left.
What kills a deal is rarely the concentration itself. It is the discovery of it by somebody else, on a date you didn’t choose.
An hour with a sheet of paper buys the one thing diligence never sells, which is the right to choose the date this gets discussed.
Questions owners ask about this
What customer concentration percentage is a red flag to buyers?
In private online businesses of this size, one customer above 30% of revenue changes the shape of a deal rather than just the price. Between 20% and 30%, the price starts to move, and below 10% it rarely comes up at all. These are the bands this practice uses rather than a published industry standard.
How much does customer concentration reduce a business’s value?
It tends to show up in the structure of a deal before it shows up in the multiple. A buyer who can’t get comfortable with one large relationship will often move money into an earn-out or an escrow instead of cutting the headline number. That puts the risk back on the seller. The multiple survives and the cash at closing doesn’t.
How do buyers find revenue concentration during due diligence?
Buyers find much of it from outside, before diligence starts. They read the email domains in a customer list, the referral and campaign data in an analytics export, the public ad library, the backlink profile, and any marketplace or app store listing. Inside diligence they add the top-ten customer table, the unpaid-invoice ageing and the contracts.
Can a business have hidden concentration with no large customer?
Yes. A business can have thirty customers with none above 10% of revenue, while most of those customers arrived through one channel, platform or partner. A share-of-revenue test looks at one customer at a time, so it reports nothing about what the customers have in common.
The count above is yours to run on paper, and you don’t need me for it. What the exit-readiness assessment does is the part next to it: three minutes, a score on how a buyer reads the rest of the business, and your three largest gaps priced. It will not find the correlation you just counted. Worse, it will score you as spread, because it asks what share each customer is and never what your customers have in common. That question isn’t in it yet, and it will be once there’s enough live data to write it properly rather than guess. Read your quality score with that in your hand. It’s free, no call, and if you’re more than three years from a sale it will bore you, so leave it.
Take the exit-readiness assessment